The trading journal that builds your edge.

EdgeFlow finds what actually creates your edge

An edge is never one thing. It is a specific combination — the technical setup, the market environment it happens in, and how you execute it. Below is the real Edge Builder on a sample trader's journal: build a combination and it tells you, honestly, whether that combination holds up.

Click conditions below — most combinations turn out to be nothing. That is the point.

app.youredgeflow.com
Sample data

Build a combination

Click any condition ↓

Mix conditions from any layer. Each combination is tested against 2,200 journalled trades.

Technical setup

Market environment

Execution

Also tested — these lose money

Add one and watch the number drop.

2 conditions selected
Validated edge

This combination is a real edge

On their own these conditions are worth +0.25R per trade. Combined, they compound to +0.35R — because the conditions reinforce each other across layers.

Your combination

Technical setup
Liquidity swept+0.17R
Market environment
— nothing from this layer —
Execution
LTF confirmation+0.13R

Separately these are worth +0.25R. Together, +0.35R. The extra +0.10R only exists in the combination.

Combined, verified edge

+0.35Rper trade

49%

win rate

611

matched

+0.31R

worst case

Overfitting barometerRobust
RobustWatchOverfit risk

611 trades across 2 conditions = 305.5 per condition. Plenty of data behind each rule — unlikely to be a fluke.

Built from 2 conditions and re-verified on held-back trades — worst-case bound still +0.31R.

$29/mo · cancel anytime

Every condition, scored on its own

notice how weak they are alone

Technical setup

Liquidity sweptin combo
+0.17R
924t
Inducement taken
+0.13R
748t
Fresh HTF zone
+0.12R
836t
Clean buildup
+0.10R
660t
Premium / discount
+0.09R
968t
CHoCH confirmed
+0.07R
792t
Nested HTF POI
+0.06R
616t
BOS
+0.02R
1210t
FVG presentnoise
0.00R
1210t
Into opposing HTF POI
−0.21R
572t
Mitigated zone
−0.19R
770t
No inducement
−0.12R
880t
Weak origin move
−0.11R
726t

Market environment

HTF trending
+0.11R
990t
MTF trending
+0.07R
1100t
LTF trending
+0.03R
1210t
London session
+0.08R
660t
Asia session
−0.18R
396t

Execution

LTF confirmationin combo
+0.13R
1056t
Entry on retest
+0.06R
880t
Order block entry
+0.02R
990t
Grab-shift triggernoise
0.00R
770t
Structural stopnoise
0.00R
1760t
Chased entry
−0.16R
682t

Trading this combination vs trading everything

The whole journal+2.7R
2200 trades+0.03R
Only this combination+17.4R
611 trades+0.35R

611 trades match this combination — the other 1589 are what was quietly costing you.

1

No single layer is the edge

A sweep on its own is worth +0.17R. A trending market on its own, less. The edge only shows up when the setup, the environment and the execution line up at the same time.

2

Combinations compound

Two conditions that are weak apart can be strong together. That gap is what you are paying for — and you never see it testing confluences one at a time.

3

Stack too many and it is curve-fitting

Every condition narrows the sample. Six conditions on thirty trades is not an edge. The barometer tells you when you have crossed that line.

Sound familiar?

You don't have a discipline problem.

You have a measurement problem. And no amount of willpower fixes a measurement problem.

500 trades journaled. Zero answers.

You log everything. Screenshots, notes, emotions. But ask where and when your setup actually performs, and the honest answer is: no idea.

Confluences you can't rank.

1H demand, trendline break, session, BOS. You trade combinations every day. Which ones together actually produce profit and which just look good on a chart? You're guessing.

One bad week and doubt takes over.

Is the edge gone or is this normal variance? Without proof you can't tell the difference. So you tweak, switch, and start over. Again.

EdgeFlow fixes it in four steps. Starting with something you already know: a journal.

First things first

A complete trading journal.

Everything you expect from a journal is here. The edge building sits on top of it.

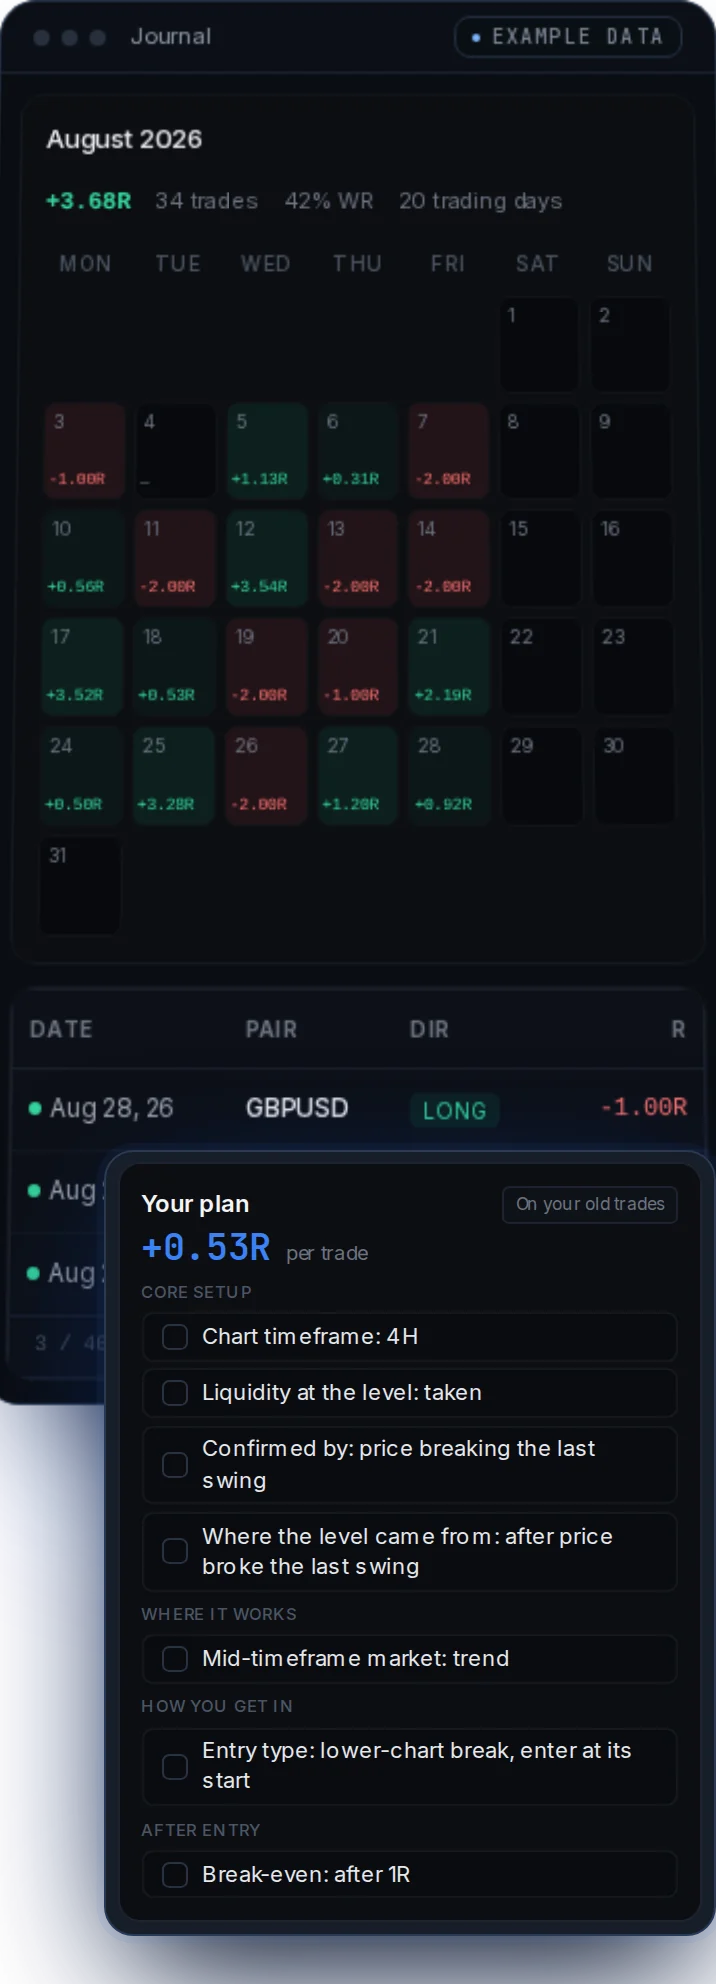
Trade log

results, R and context

Equity curve

R-based, per account

Full statistics

win rate, R, streaks

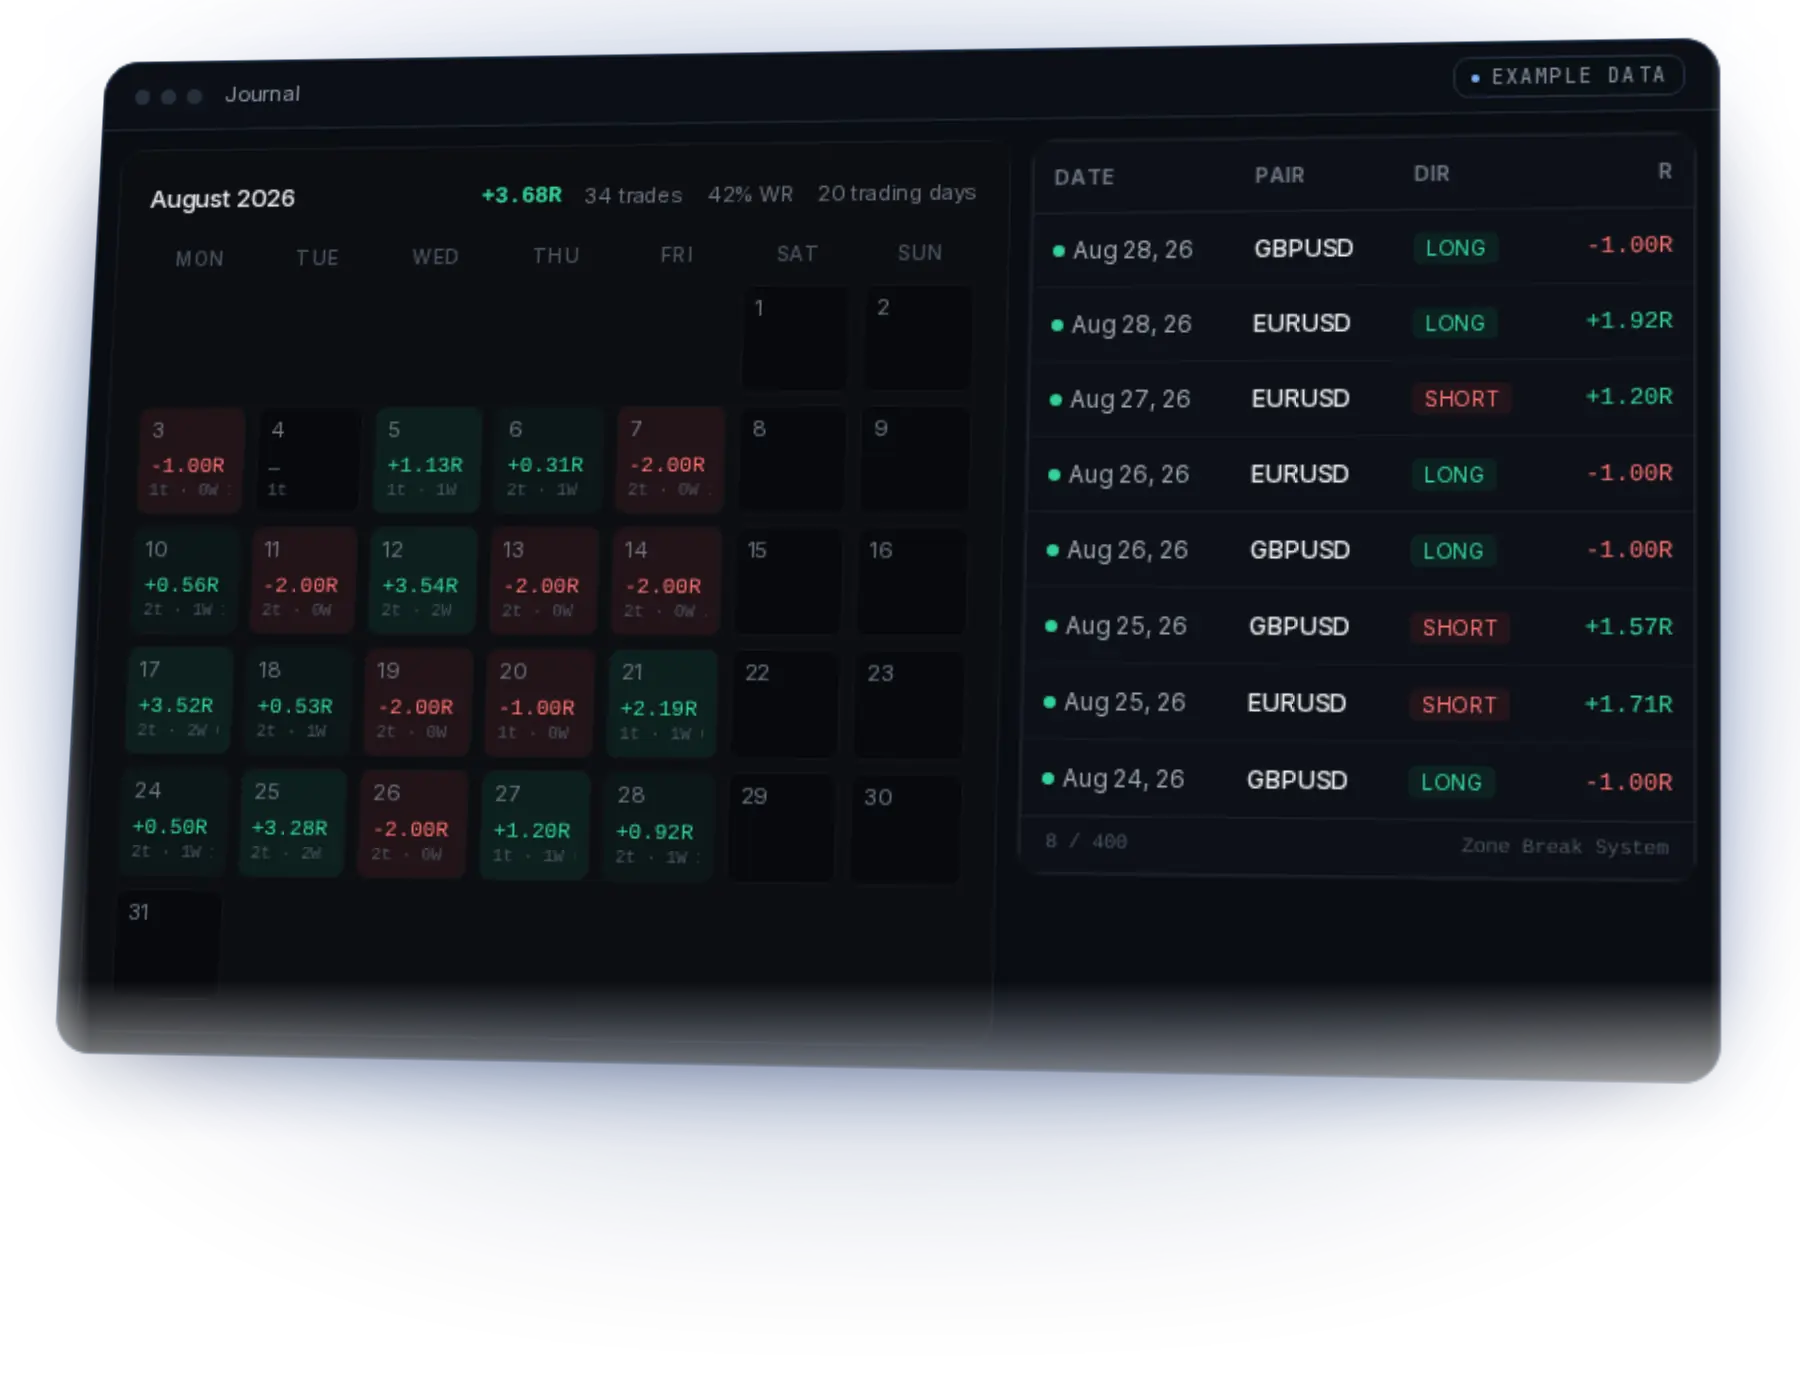
Calendar view

your month at a glance

Notes & screenshots

attached per trade

Psychology tracking

mood and rule checks

But a journal only stores your trades. Here is how EdgeFlow turns them into an edge.

How EdgeFlow works

From logged trade
to proven plan.

Every number below comes from the same story: 500 journal trades, one pullback setup, and the edge hiding inside it.

MGCLONG
+2.1R9 conditions tagged
Environment
4H uptrendLondon openNo red news
Zone
1H demand zoneFirst test
Entry
15m BOS5m rejection wick
Risk
Stop behind 15m swingBE at 1RPartial at 2R
"Clean retrace, waited for the wick."#487 of 500
STEP 01

Log what you saw, not just what you got.

Every trade you log gets a few tags: the trend, the zone, the session, your entry signal, your stop. Those tags are exactly what EdgeFlow analyzes later.

  • 4H trend, 1H demand zone, session
  • 15m BOS, 5m rejection wick
  • Stop placement and management
Every trade you log feeds the loop again. The plan gets sharper while you trade it.
Decision impact
your trades, replayed both ways
Decision
Without
With
Impact
BE at 1R
+0.04R
+0.21R
+0.17R
Trail after 2R
+0.18R
+0.34R
+0.16R
Partial at 2R
+0.27R
+0.41R
+0.14R
BE at 0.5R
+0.31R
+0.12R
−0.19R
Manual early close
+0.36R
−0.09R
−0.45R

The early breakeven felt disciplined. It was a 0.19R tax on every trade.

Trade management

Same entries. Different exits. The gap is measurable.

EdgeFlow compares your trades with and without each decision. Moving your stop to breakeven early feels safe. Here it cost 0.19R per trade.

Keep the decisions that pay. Drop the habits that only feel safe.

  • Breakeven timing, tested per setup
  • Trailing vs fixed target, in R
  • Partial exits and what they really cost
  • Manual closes vs letting the plan finish

Meet Flow

Your trading companion.

Pattern detected

Your last 12 trades after a loss are returning −0.41R. Worth pausing for review.

Flow reads your journal the way a coach would.

It stays quiet while you trade well. It speaks up when a pattern starts costing you: after a loss, after a rule break, after a week of oversized risk.

  • Spots recurring mistakes before they become habits
  • Flags behavioral drift in plain numbers
  • Finds the leaks your stats page hides
  • Keeps you accountable to your own rules

Psychology

The biggest leak isn't on the chart.

It's the trade you take five minutes after a loss. In this journal those trades ran at −0.34R, eleven times.

EdgeFlow puts a price on your habits. Not to shame you. So you know exactly which one to cut first.

  • Revenge entries, priced in R
  • Overtrading past your daily edge
  • Rule breaks and what each one cost
  • Your discipline score, tracked weekly
Psychology
last 90 days

Discipline

74/100

Rule breaks

14

Cost of habits

−0.81R

Top leaks

Entries within 5 min of a loss
11x−0.34R
Size increased after a red day
9x−0.28R
Stop widened mid-trade
7x−0.19R

Flow

Your discipline score drops 17% on days with more than 3 trades. Trade 4 and beyond runs at −0.22R. Consider capping at 3.

Community

You're not building alone.

The leaderboard ranks traders on consistency, not on one lucky month. Stick to your plan, climb the board.

New here? Start from a plan template another trader already proved, then test it on your own trades before you risk a cent on it.

  • Leaderboard based on plan match and consistency
  • Share your trade plans as templates
  • Copy a template, prove it on your own data first
Consistency leaderboard
this month
#
Trader
Plan match
30d
Streak
1
Milan V.
96%
+18.4R
21 days
2
Jesse K.
94%
+15.2R
14 days
3
Sofia R.
91%
+12.8R
9 days
4
Daan B.
89%
+11.1R
12 days
12
You
84%
+6.2R
5 days
Shared template

London Breakout Continuation

used 412x · community avg +0.38R

Shared template

NY Open Pullback

used 268x · community avg +0.29R

A setup is
not an edge.

The edge is knowing when it works, where it works and how to manage it.

Everything else is guessing with confidence.

Why EdgeFlow

Most journals track trades.
EdgeFlow develops traders.

Traditional journal

EdgeFlow

Tracks trades.

Tracks causes.

Stores data.

Builds proof.

Shows results.

Explains results.

Tracks performance.

Improves performance.

Pricing

Stop guessing.
Start measuring your edge.

Understand when your setup works, where it works, and how it should be managed.

$29.08/month

Billed $349 yearly · Save $71 (17% off) · incl. VAT

  • Discover what creates expectancy

    See which conditions, sessions and setups actually move your numbers.

  • Build evidence-backed trade plans

    Save validated patterns as living playbooks. EdgeFlow tracks live vs expected automatically.

  • Improve trade management with data

    Find your real edge in target placement, breakeven timing and partial exits.

  • Identify psychology leaks

    Surface the emotional patterns and rule breaks that quietly drain your results.

  • Learn with Flow, your trading companion

    A coach that stays quiet until your patterns drift.

Built for traders who want answers to

Why does my setup work?
When does it fail?
Which symbols perform best?
Which management decisions help expectancy?

The answers are already in your data.

Secure checkout via Stripe · Cancel any time from Settings

EdgeFlow Elite Trader · backtesting engine and community building · launching late 2026 · Pro members get early access.

FAQ

Questions traders ask before signing up

Still have questions? Contact us — we reply within one business day.

Your journal
already knows.

The answer isn't another strategy. It's proof.

Start building it with the next trade you log.